 |
| Information mapping |
|---|
| Topics & fields |
| Node–link approaches |
| See also |
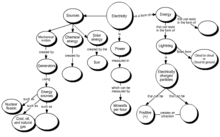
A concept map typically represents ideas and information as boxes or circles, which it connects with labeled arrows in a downward-branching hierarchical structure. The relationship between concepts can be articulated in linking phrases such as causes, requires, or contributes to.[2]
The technique for visualizing these relationships among different concepts is called concept mapping. Concept maps have been used to define the ontology of computer systems, for example with the object-role modeling or Unified Modeling Language formalism.
Contents
[hide]Overview[edit]
A concept map is a way of representing relationships between ideas, images, or words in the same way that a sentence diagram represents the grammar of a sentence, a road map represents the locations of highways and towns, and a circuit diagram represents the workings of an electrical appliance. In a concept map, each word or phrase connects to another, and links back to the original idea, word, or phrase. Concept maps are a way to develop logical thinking and study skills by revealing connections and helping students see how individual ideas form a larger whole. An example of the use of concept maps is provided in the context of learning about types of fuel.[clarification needed][3]Concept maps were developed[according to whom?] to enhance meaningful learning in the sciences[citation needed]. A well-made concept map grows within a context frame defined by an explicit "focus question", while a mind map often has only branches radiating out from a central picture. Some research evidence suggests that the brain stores knowledge as productions (situation-response conditionals) that act on declarative memory content, which is also referred to as chunks or propositions.[4][5] Because concept maps are constructed to reflect organization of the declarative memory system, they facilitate sense-making and meaningful learning on the part of individuals who make concept maps and those who use them.
Differences from other visualizations[edit]
- Topic maps: Concept maps are rather similar to topic maps in that both allow to concepts or topics via graphs. Among the various schema and techniques for visualizing ideas, processes, and organizations, concept mapping, as developed by Joseph Novak is unique in its philosophical basis, which "makes concepts, and propositions composed of concepts, the central elements in the structure of knowledge and construction of meaning."[6]
- Mind maps: Both concept maps and topic maps can be contrasted with mind mapping, which is often restricted to radial hierarchies and tree structures. Another contrast between concept mapping and mind mapping is the speed and spontaneity when a mind map is created. A mind map reflects what you think about a single topic, which can focus group brainstorming. A concept map can be a map, a system view, of a real (abstract) system or set of concepts. Concept maps are more free form, as multiple hubs and clusters can be created, unlike mind maps, which fix on a single two centered approach.
History[edit]
The technique of concept mapping was developed by Joseph D. Novak and his research team at Cornell University in the 1970s as a means of representing the emerging science knowledge of students.[7] It has subsequently been used as a tool to increase meaningful learning in the sciences and other subjects as well as to represent the expert knowledge of individuals and teams in education, government and business. Concept maps have their origin in the learning movement called constructivism. In particular, constructivists hold that learners actively construct knowledge.Novak's work is based on the cognitive theories of David Ausubel, who stressed the importance of prior knowledge in being able to learn (or assimilate) new concepts: "The most important single factor influencing learning is what the learner already knows. Ascertain this and teach accordingly."[8] Novak taught students as young as six years old to make concept maps to represent their response to focus questions such as "What is water?" "What causes the seasons?" In his book Learning How to Learn, Novak states that a "meaningful learning involves the assimilation of new concepts and propositions into existing cognitive structures."
Various attempts have been made to conceptualize the process of creating concept maps. Ray McAleese, in a series of articles, has suggested that mapping is a process of off-loading. In this 1998 paper, McAleese draws on the work of Sowa[9] and a paper by Sweller & Chandler.[10] In essence, McAleese suggests that the process of making knowledge explicit, using nodes and relationships, allows the individual to become aware of what they know and as a result to be able to modify what they know.[11] Maria Birbili applies that same idea to helping young children learn to think about what they know.[12] The concept of the knowledge arena is suggestive of a virtual space where learners may explore what they know and what they do not know.
Use[edit]
Concept maps are used to stimulate the generation of ideas, and are believed to aid creativity.[2] Concept mapping is also sometimes used for brain-storming. Although they are often personalized and idiosyncratic, concept maps can be used to communicate complex ideas.Formalized concept maps are used in software design, where a common usage is Unified Modeling Language diagramming amongst similar conventions and development methodologies.
Concept mapping can also be seen as a first step in ontology-building, and can also be used flexibly to represent formal argument — similar to argument maps.
Concept maps are widely used in education and business. Uses include:
- Note taking and summarizing gleaning key concepts, their relationships and hierarchy from documents and source materials
- New knowledge creation: e.g., transforming tacit knowledge into an organizational resource, mapping team knowledge
- Institutional knowledge preservation (retention), e.g., eliciting and mapping expert knowledge of employees prior to retirement
- Collaborative knowledge modeling and the transfer of expert knowledge
- Facilitating the creation of shared vision and shared understanding within a team or organization
- Instructional design: concept maps used as Ausubelian "advance organizers" that provide an initial conceptual frame for subsequent information and learning.
- Training: concept maps used as Ausubelian "advanced organizers" to represent the training context and its relationship to their jobs, to the organization's strategic objectives, to training goals.
- Communicating complex ideas and arguments
- Examining the symmetry of complex ideas and arguments and associated terminology
- Detailing the entire structure of an idea, train of thought, or line of argument (with the specific goal of exposing faults, errors, or gaps in one's own reasoning) for the scrutiny of others.
- Enhancing metacognition (learning to learn, and thinking about knowledge)
- Improving language ability
- Assessing learner understanding of learning objectives, concepts, and the relationship among those concepts
- Lexicon development
See also[edit]
References[edit]
- Jump up ^ Peter J. Hager,Nancy C. Corbin. Designing & Delivering: Scientific, Technical, and Managerial Presentations, 1997, . 163.
- ^ Jump up to: a b Joseph D. Novak & Alberto J. Cañas (2006). "The Theory Underlying Concept Maps and How To Construct and Use Them", Institute for Human and Machine Cognition. Accessed 24 Nov 2008.
- Jump up ^ CONCEPT MAPPING FUELS Archived 2011-07-21 at the Wayback Machine.. Accessed 24 Nov 2008.
- Jump up ^ Anderson, J. R., & Lebiere, C. (1998). The atomic components of thought. Mahwah, NJ: Erlbaum.
- Jump up ^ Anderson, J. R., Byrne, M. D., Douglass, S., Lebiere, C., & Qin, Y. (2004). An Integrated Theory of the Mind. Psychological Review, 111(4), 1036–1050.
- Jump up ^ Novak, J.D. & Gowin, D.B. (1996). Learning How To Learn, Cambridge University Press: New York, p. 7.
- Jump up ^ "Joseph D. Novak". Institute for Human and Machine Cognition (IHMC). Retrieved 2008-04-06.
- Jump up ^ Ausubel, D. (1968) Educational Psychology: A Cognitive View. Holt, Rinehart & Winston, New York.
- Jump up ^ Sowa, J.F., 1983. Conceptual structures: information processing in mind and machine, Addison-Wesley.
- Jump up ^ Sweller, J. & Chandler, P., 1991. Evidence for Cognitive Load Theory. Cognition and Instruction, 8(4), p.351-362.
- Jump up ^ McAleese, R. (1998) The Knowledge Arena as an Extension to the Concept Map: Reflection in Action, Interactive Learning Environments, 6(3), p.251–272.
- Jump up ^ Birbili, M. (2006) "Mapping Knowledge: Concept Maps in Early Childhood Education", Early Childhood Research & Practice, 8(2), Fall 2006
Further reading[edit]
- Novak, J.D. (2009). Learning, Creating, and Using Knowledge: Concept Maps as Facilitative Tools in Schools and Corporations (2nd ed.). Routledge. ISBN 9780415991858.
- Novak, J.D.; Gowin, D.B. (1984). Learning How to Learn. Cambridge: Cambridge University Press. ISBN 9780521319263.
External links[edit]
| Wikimedia Commons has media related to Concept map. |
| Wikiversity has learning resources about Concept mapping |
- Example of a concept map from 1957 by Walt Disney.


